- the performance of Webiny Page Builder
Results
| Total requests | Avg. response time (ms) | Throughput (req/sec) |
|---|---|---|
| 2,274,117 | 267 | 3,613 |
Requests per second is a number that helps you calculate how many users you can actually serve. The other part of that calculation is to know how your users behave. How fast they navigate between pages in this case.
As an example say your average visitors stays on your site 5 minutes, and visits around 10 pages. That’s 2 pages a minute. With a throughput of 3,613req/sec, you can handle 216,780 pages a minute, or 108,390 visitors in a minute.
Benchmark overview
In this test we are requesting the default homepage that comes with Webiny Page Builder. We’re fetching the HTML of that page. The linked assets like CSS, JS and images are not loaded. The payload size we are retrieving is 25.9kb compressed (or 778kb uncompressed).
Load structure
We are sending 1,000 users to the website with a ramp up period of 25s, meaning each second 40 new users are coming to the page. After the ramp up period, for the next 10 minutes we are keeping the load of 1000 users constantly requesting the page. There is no caching on the “client” side happening.
Response times

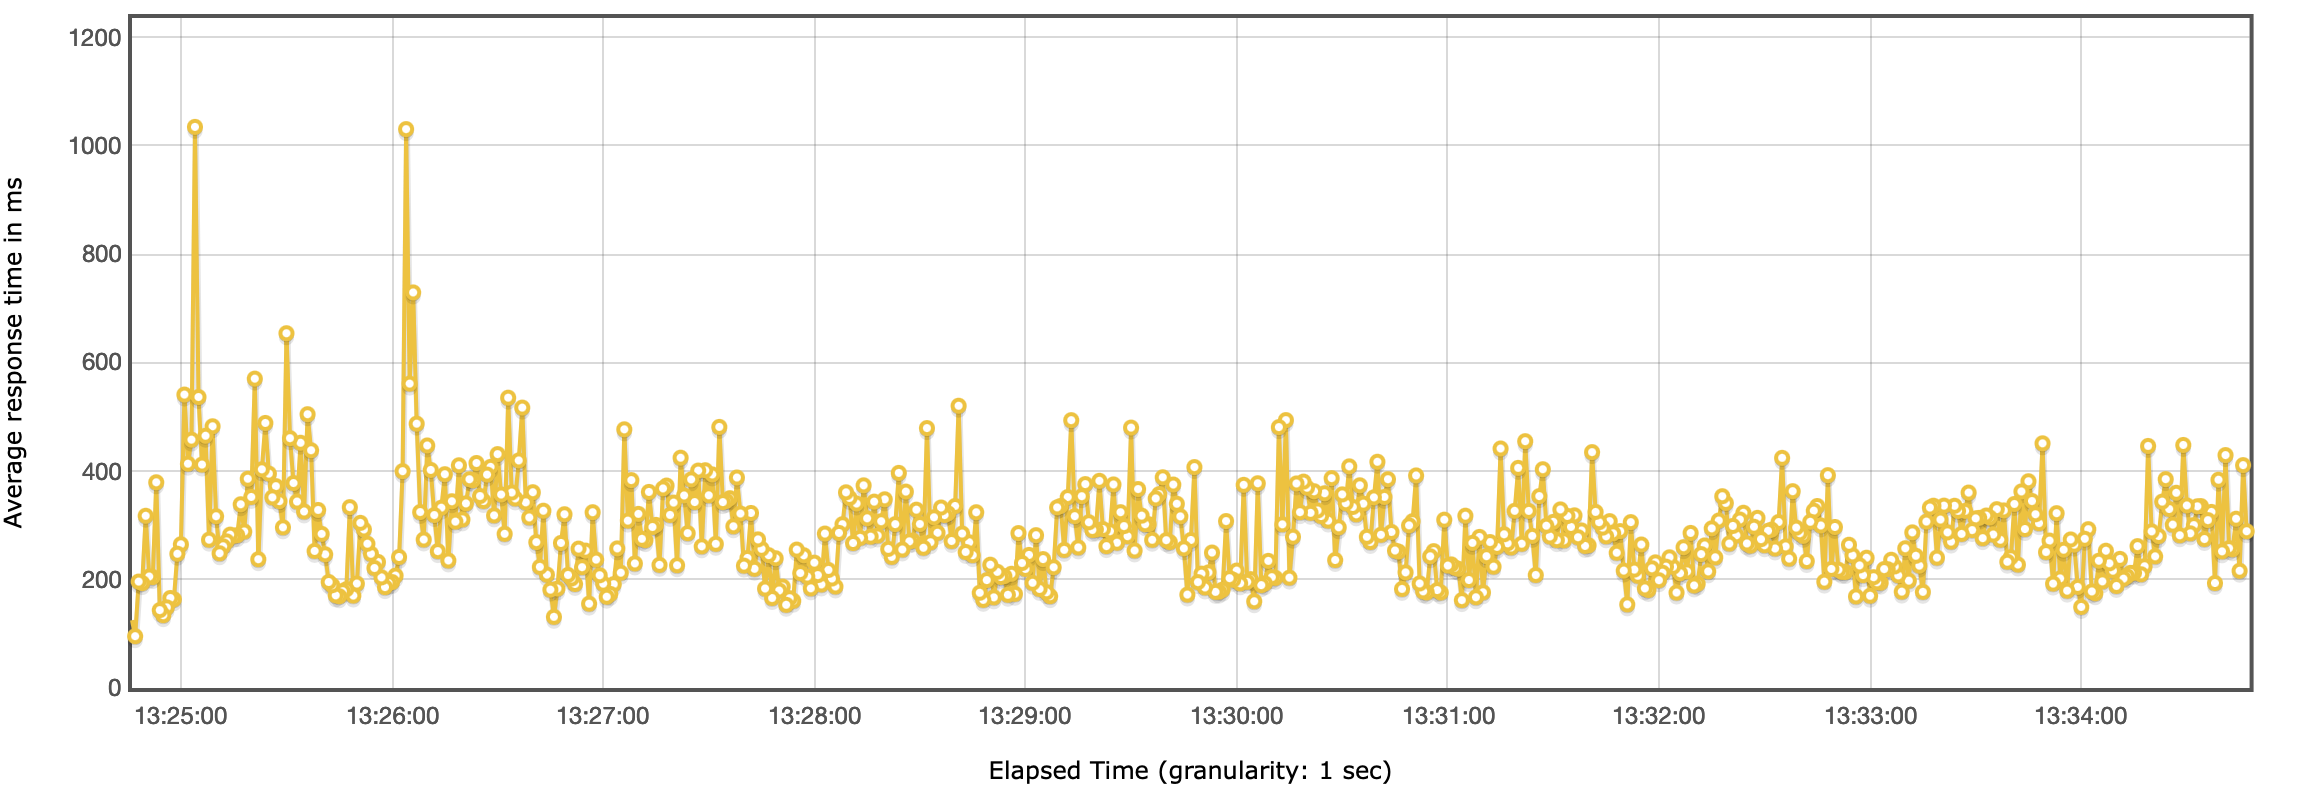
Average response time is 267ms, while 95% of all the requests were delivered with a response time not greater than 805ms (p95).
Throughput

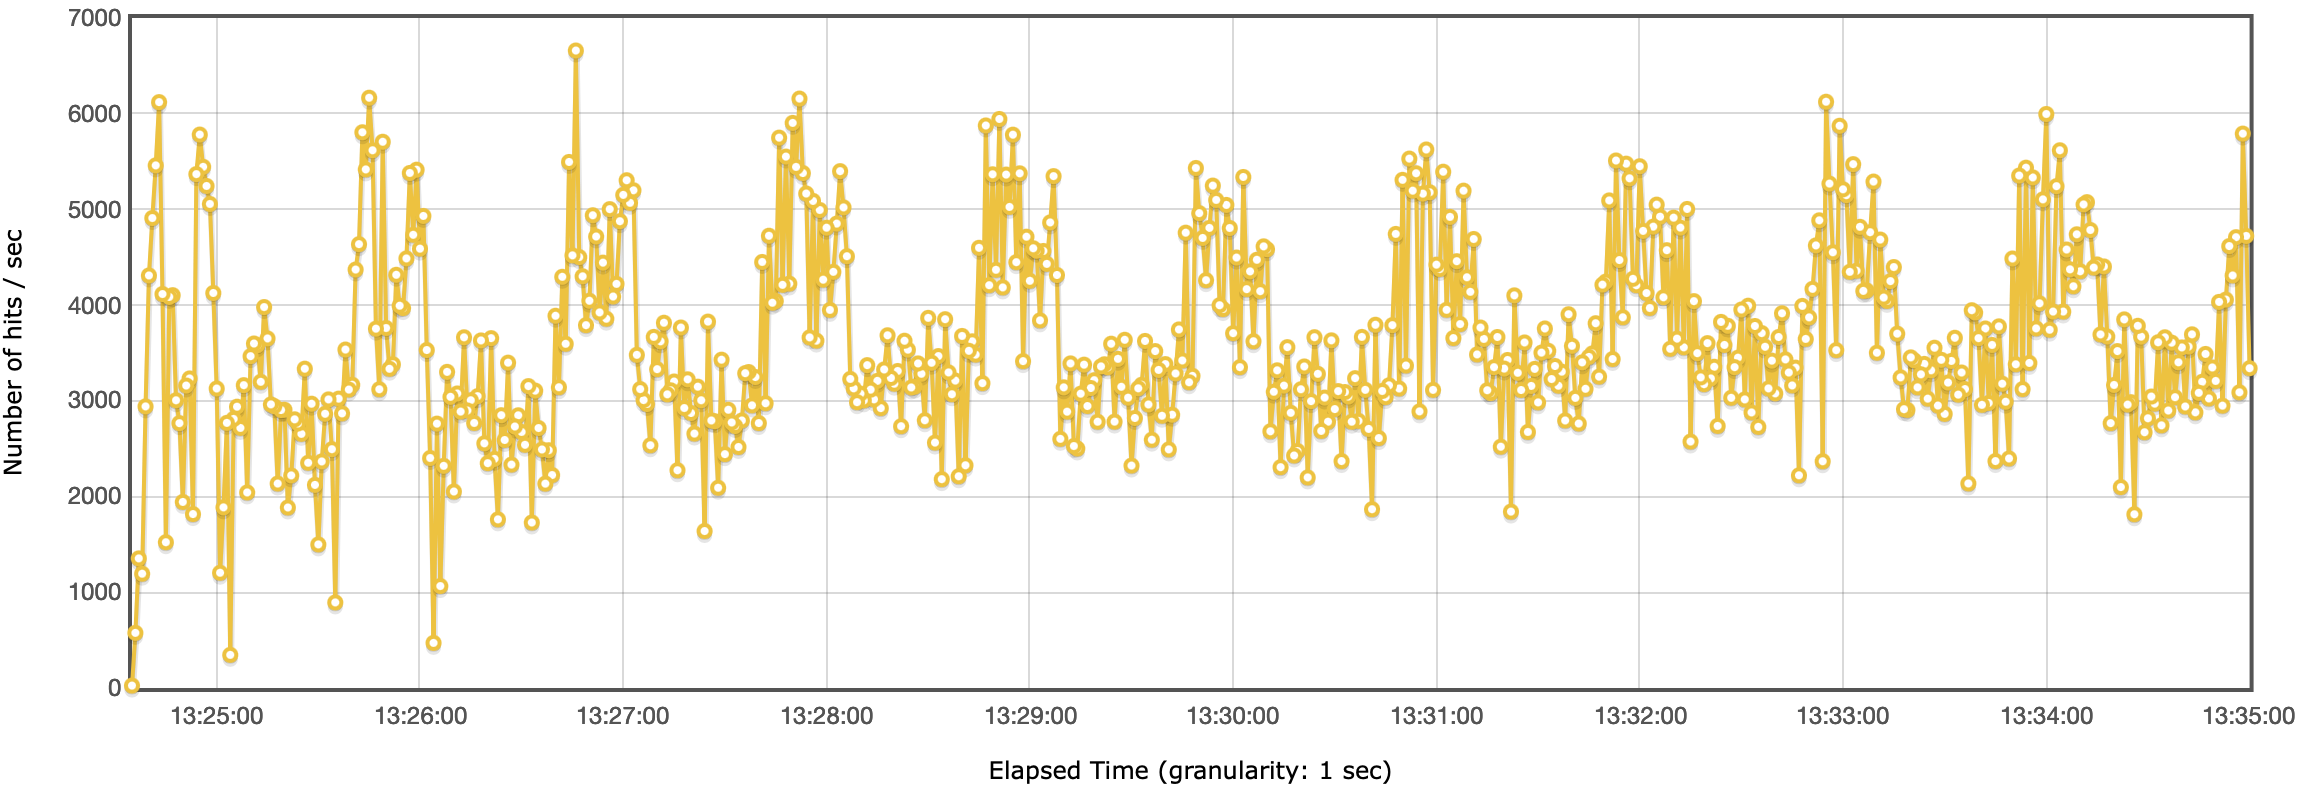
Average throughput was 3,613 req/sec, while at peak the system handled more than 6,500 req/sec. From the picture you can see that the pattern was more or less consistent, especially after the first 2 minutes have elapsed.
Important note
Due to the nature of how Webiny works, when you publish a page in the Page Builder, Webiny triggers a prerendering service which creates a HTML snapshot of your page, together with a file that caches all the GraphQL queries that page issues. It’s a very similar mechanism to how most static page generators work like Gatsby, Jekyll and Hugo.
However Webiny differs in its workflow. In Page Builder when you press the publish button on a page, this generation of the HTML and GraphQL cache is created in the background by a dedicated Lambda function. There is no need to upload any files, or do rebuilds of your whole site locally. Incremental builds are automatically handled, so you also don’t worry about that. This whole process takes a few seconds after the page has been published.
The cached files are then saved on to an S3 bucket, which has a CloudFront CDN in front. When a client requests a page, it’s only a request to CloudFront and then to S3, if the page is not already cached. There are no Lambdas are involved in the delivery.
Because CloudFront is a CDN with many distributed edges, the throughput actually increases if your users are geographically distributed as the load is spread across multiple edges. By default a single CloudFront distribution can handle around 250,000 req/sec.
You might say we’re load testing a CDN in our case, that’s true, but this is how your Webiny instance will look in production and it’s a representative example.
Cost
Calculating the cost in this case is rather simple, due to the flow explained above. The costs that are occurring are the CloudFront hits and traffic. We’re ignoring S3 in this case, as only a few request landed there before the file was cached in CloudFront.
In our tests the cost factors are:
- Total number of hits: 2,274,117
- Total traffic: ~58.9GB (number of hits * 25.9kb payload size)
Which brings us to:
- Hits cost = $2.73 ($0.0120 price per 10k HTTPS requests * 2,274,117)
- Traffic cost = $4.00 ($0.085 price per GB * 58.9 GB)
TOTAL COST = $6.73
COST PER 10K HITS = $0.02959
You can download and check the full report here: https://github.com/webiny/benchmark/tree/main/benchmarks/results/pb-page-delivery/report
